
❗️❗️❗️ Pre-Requisite & Installation❗️❗️❗️
1️⃣ Make sure you have python version 3.6 or higher to leverage this python feature.
2️⃣ As this python module uses “Graphviz” to render the diagram you need to make sure to install graphviz by going to link and install package based on your operating system.
🔳 Installation for windows machine is as follows
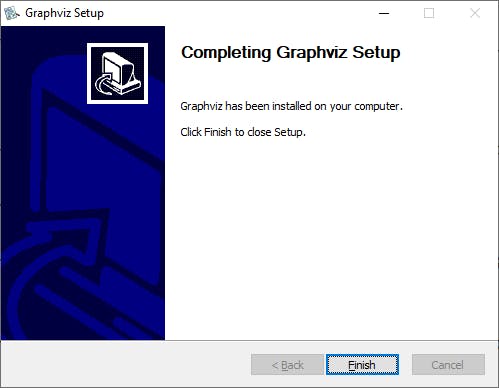
✦ Download Stable Windows install packages “graphviz-3.0.0” for 64 bit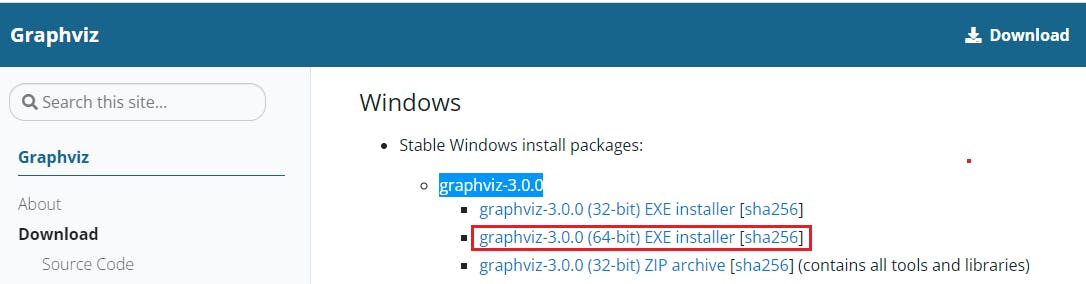 ✦ Once package is downloaded run it and follow along.
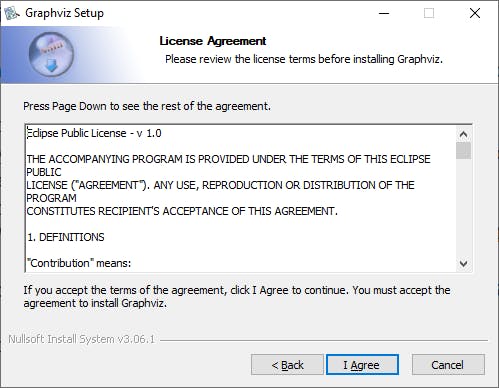
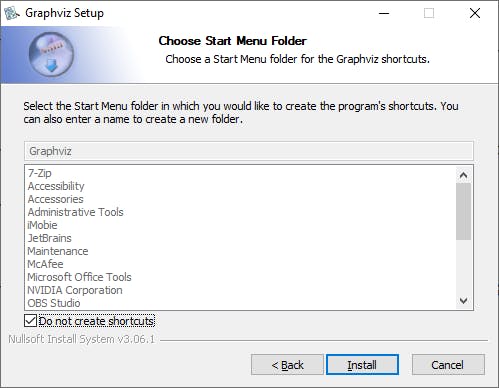
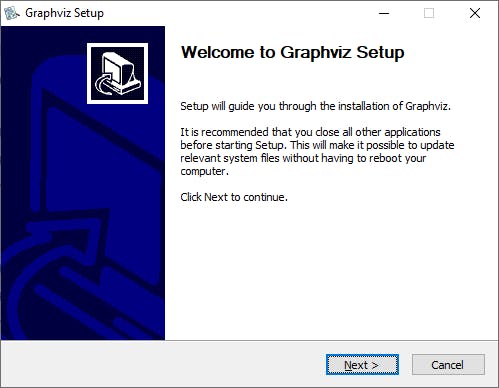
 ✦ Add Graphviz to system path
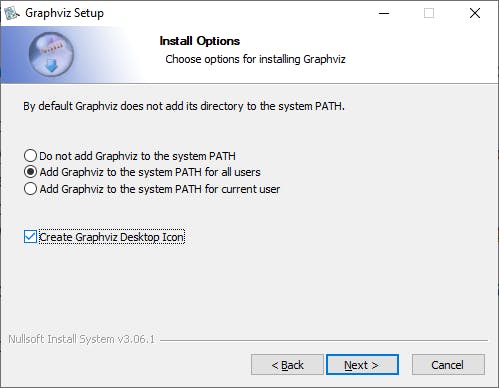 ✦ Select destination folder to install the packages and install
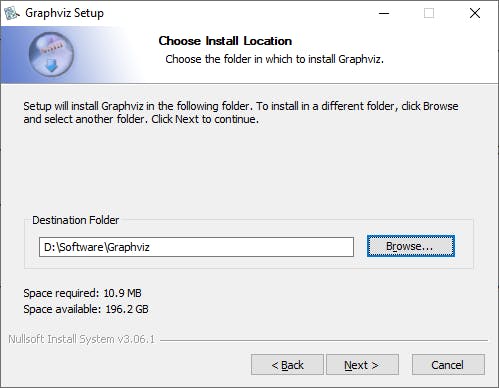
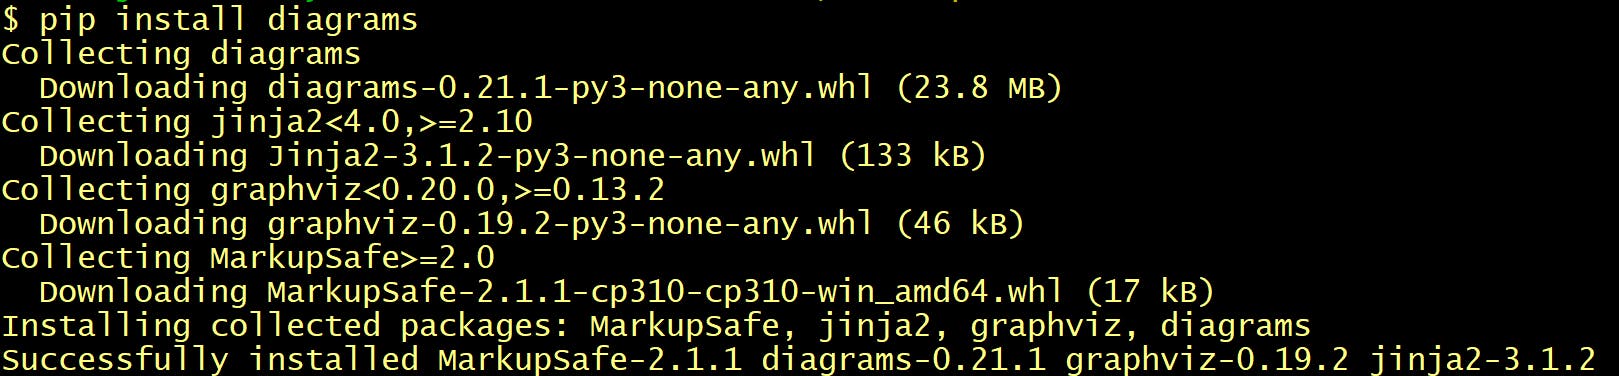
3️⃣ Once graphviz is installed successfully we need to install diagrams by using below command which completes our installation
pip install diagrams
🌟Understanding Basic Building Blocks🌟
Before building basic architecture you needs to be well versed with important concepts listed below
🔳 Diagrams:- In simple terms diagram name. Diagram is a primary object representing a diagram for which Diagram constructor will be used for output filename.
Create python file first_diagram with below code
from diagrams import Diagram
with Diagram("First_Diagram", show= True):
    pass
Run program by using below command
python first_diagram.py
################Output File “Diagram.png”################ It will generate an image file as First_Diagram.png on same path where you have created “first_diagram.py” , and open that created image file immediately as shown below which concludes it is used for naming the diagrams we are creating as code.
🔳 Nodes:- In layman terms these are AWS Services Logos .Node is a second object representing a node or system component. A node object consists of three parts: provider, resource type and name.
Lets see how we can use these nodes for AWS resources as listed below…
➖ VPC
➖ VPCRouter
➖ VPCPeering
➖ VPCElasticNetworkInterface
➖ EC2
➖ EC2Instance
➖ EC2Instances
➖ EC2Ami
➖ LambdaFunction
🔊 To view entire github code click here
from diagrams import Diagram
from diagrams.aws.network import VPC
from diagrams.aws.network import VPCRouter
from diagrams.aws.network import VPCPeering
from diagrams.aws.network import VPCElasticNetworkInterface
from diagrams.aws.compute import EC2
from diagrams.aws.compute import EC2Instance
from diagrams.aws.compute import EC2Instances
from diagrams.aws.compute import EC2Ami
from diagrams.aws.compute import LambdaFunction
with Diagram("Diagram", direction="LR"):
    VPC = VPC("VPC")
    VPCRouter = VPCRouter("VPCRouter")
    VPCPeering = VPCPeering("VPCPeering")
    VPCElasticNetworkInterface = VPCElasticNetworkInterface("VPCElasticNetworkInterface")
    EC2 = EC2("EC2")
    EC2Instance = EC2Instance("EC2Instance")
    EC2Instances = EC2Instances("EC2Instances")
    EC2Ami = EC2Ami("EC2Ami")
    LambdaFunction = LambdaFunction("LambdaFunction")
################Output File “Diagram.png”################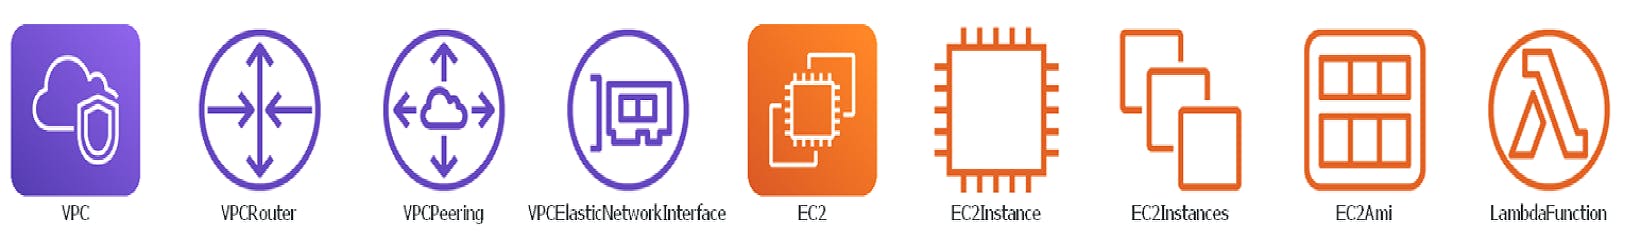
You can also use other node objects in a similar manner for different cloud providers:
# aws resources
from diagrams.aws.compute import ECS, Lambda
from diagrams.aws.database import RDS, ElastiCache
from diagrams.aws.network import ELB, Route53, VPC

# azure resources
from diagrams.azure.compute import FunctionApps
from diagrams.azure.storage import BlobStorage

# gcp resources
from diagrams.gcp.compute import AppEngine, GKE
from diagrams.gcp.ml import AutoML
Current nodes available as per the official documentation is listed below make sure to keep check on this official documentation.
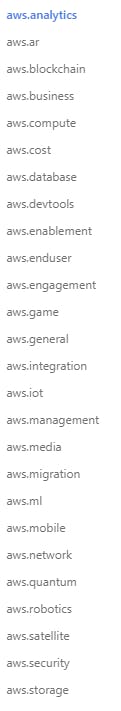
Note in this blog we are only going to focus on AWS Nodes only.
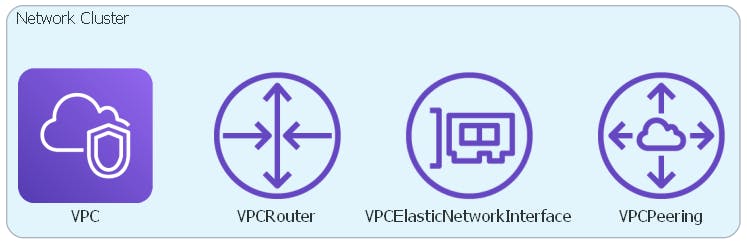
🔳 Clusters:- In simple terms clubbing of nodes[aws services] together. Lets understand how it works by writing down the code.
👨💻 Example 1:- Network Cluster | To view entire github code click here
from diagrams import Cluster, Diagram
from diagrams.aws.network import VPC
from diagrams.aws.network import VPCRouter
from diagrams.aws.network import VPCPeering
from diagrams.aws.network import VPCElasticNetworkInterface
with Diagram("Diagram", direction="TB"):
    with Cluster("Network Cluster"):
        VPCPeering = VPCPeering("VPCPeering")
        VPCElasticNetworkInterface =
        VPCElasticNetworkInterface("VPCElasticNetworkInterface")
        VPCRouter = VPCRouter("VPCRouter")
        VPC = VPC("VPC")
################Output File “Diagram.png”################
👨💻 Example 2:- Compute Cluster | 🔊 To view entire github code click here
from diagrams import Cluster, Diagram
from diagrams.aws.compute import EC2
from diagrams.aws.compute import EC2Instance
from diagrams.aws.compute import EC2Instances
from diagrams.aws.compute import EC2Ami
from diagrams.aws.compute import LambdaFunction
with Diagram("Diagram", direction="TB"):
    with Cluster("Compute Cluster"):
        EC2 = EC2("EC2")
        EC2Instance = EC2Instance("EC2Instance")
        EC2Instances = EC2Instances("EC2Instances")
        EC2Ami = EC2Ami("EC2Ami")
        LambdaFunction = LambdaFunction("LambdaFunction")
################Output File “Diagram.png”################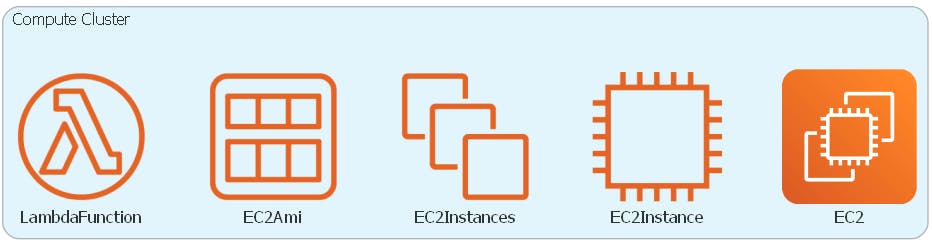
🔳 Edges:- Edge is representing an edge between Nodes. Edge is an object representing a connection between Nodes with some additional properties. An edge object contains three attributes: label, color and style which mirror corresponding graphviz edge attributes.
👨💻 Example:- Edge | 🔊 To view entire github code click here
from diagrams import Cluster, Diagram, Edge
from diagrams import Diagram
from diagrams.aws.compute import EC2
from diagrams.aws.database import RDS
from diagrams.aws.network import ELB

with Diagram("Diagram", show= True, direction="TB"):
    ELB("") >> Edge(color="red", label="Traffic") >> \
    [EC2("Instance1"),EC2("Instance2"),EC2("Instance3")]
################Output File “Diagram.png”################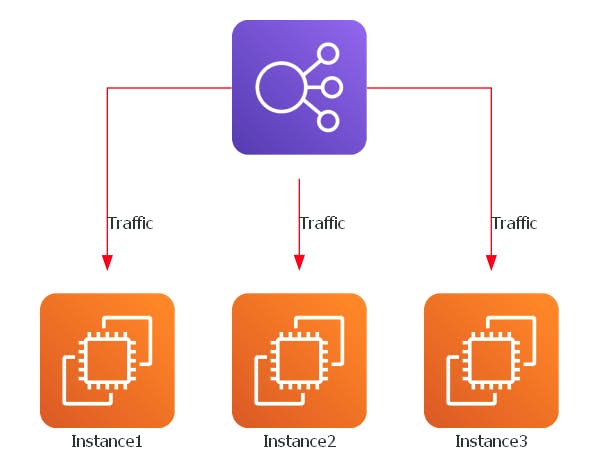
🔳 Data Flow:- You can represent data flow by connecting the nodes with these operators: >>, << and -.
✦ [>>]:- We can use this arrow direction to show route in right direction. Lets code & check..
from diagrams import Diagram
from diagrams.aws.compute import EC2
from diagrams.aws.database import RDS
from diagrams.aws.network import ELB

with Diagram("Diagram", show= True, direction="LR"):
    ELB("Load_Balancer") >> EC2("Instance") >> RDS("Database")
################Output File “Diagram.png”################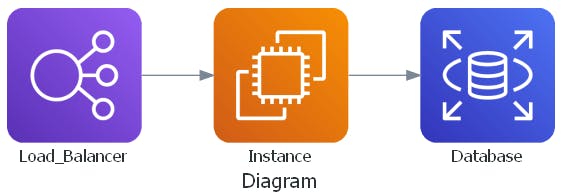
➖ [<<]:- We can use this arrow direction to show route in left direction. Lets code & check..
from diagrams import Diagram
from diagrams.aws.compute import EC2
from diagrams.aws.database import RDS
from diagrams.aws.network import ELB

with Diagram("Diagram", show= True, direction="LR"):
    ELB("Load_Balancer") << EC2("Instance") << RDS("Database")
################Output File “Diagram.png”################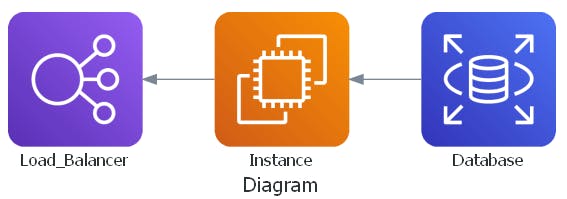
➖ [-] :- This is no direction arrow. Lets code & check..
from diagrams import Diagram
from diagrams.aws.compute import EC2
from diagrams.aws.database import RDS
from diagrams.aws.network import ELB

with Diagram("Diagram", show= True, direction="LR"):
    ELB("Load_Balancer") - EC2("Instance") - RDS("Database")
################Output File “Diagram.png”################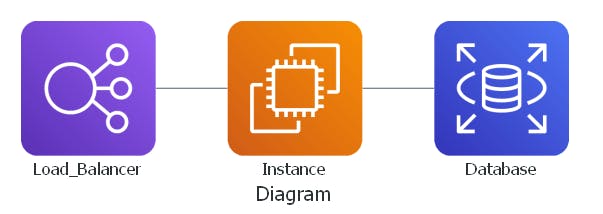
➖ [TB] :- Diagram flow will be from top to bottom. Lets code & check..
from diagrams import Diagram
from diagrams.aws.compute import EC2
from diagrams.aws.database import RDS
from diagrams.aws.network import ELB

with Diagram("Diagram", show= True, direction="TB"):
    ELB("Load_Balancer") >> EC2("Instance") >> RDS("Database")
################Output File “Diagram.png”################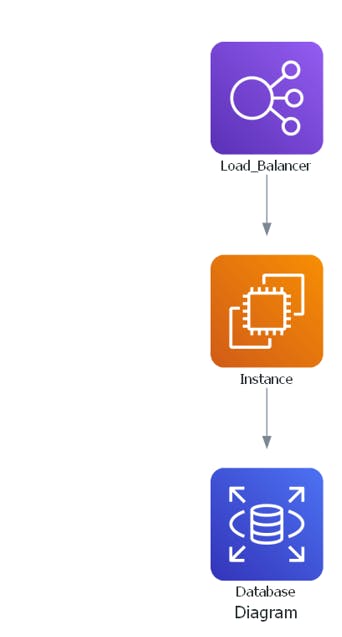 ➖ [BT] :- Diagram flow will be from bottom to top. Lets code & check..
from diagrams import Diagram
from diagrams.aws.compute import EC2
from diagrams.aws.database import RDS
from diagrams.aws.network import ELB

with Diagram("Diagram", show= True, direction="BT"):
    ELB("Load_Balancer") >> EC2("Instance") >> RDS("Database")
################Output File “Diagram.png”################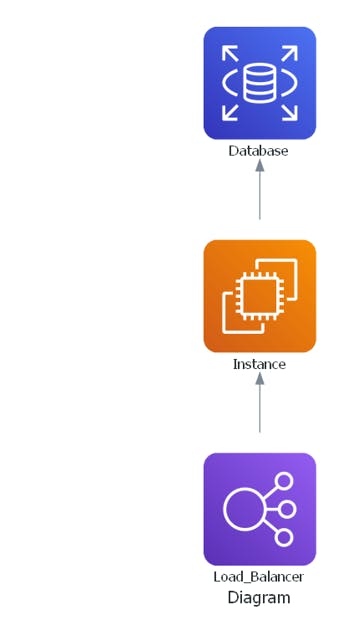 ➖ [LR] :- Diagram flow will be from left to right. Lets code & check..
from diagrams import Diagram
from diagrams.aws.compute import EC2
from diagrams.aws.database import RDS
from diagrams.aws.network import ELB

with Diagram("Diagram", show= True, direction="LR"):
    ELB("Load_Balancer") >> EC2("Instance") >> RDS("Database")
################Output File “Diagram.png”################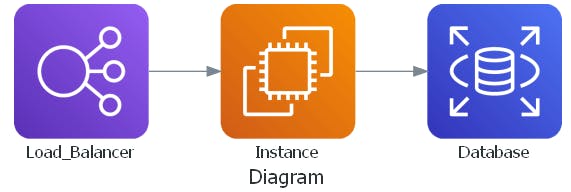
➖ [RL] :- Diagram flow will be from right to left. Lets code & check..
from diagrams import Diagram
from diagrams.aws.compute import EC2
from diagrams.aws.database import RDS
from diagrams.aws.network import ELB

with Diagram("Diagram", show= True, direction="RL"):
    ELB("Load_Balancer") >> EC2("Instance") >> RDS("Database")
################Output File “Diagram.png”################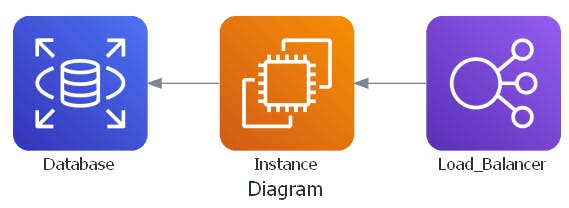
🌟AWS 3 Teir Architecture Diagram As Code🌟
from diagrams importCluster, Diagramfromdiagrams.aws.databaseimportRDSfromdiagrams.aws.computeimportEC2fromdiagrams.aws.networkimportELBfromdiagrams.aws.networkimportRoute53withDiagram("Simple Web Service with DB Cluster", show=True, direction="TB"):
    Web_LB=ELB("Web_Load_Balancer")
    App_LB=ELB("App_Load_Balancer")
    DNS=Route53("Route53")
    DB=RDS("Database")

    withCluster("Web Teir"):
        web_teir= [EC2("NginxProxy"),
                   EC2("NginxProxy1"),
                   EC2("NginxProxy2")]
    withCluster("App Teir"):
        app_teir= [EC2("app1"),
                   EC2("app2"),
                   EC2("app3")]


    DNS>>Web_LB>>web_teirweb_teir>>App_LBApp_LB>>app_teirapp_teir>>DB
🔊 **To view entire github code click here
################Output File “Diagram.png”################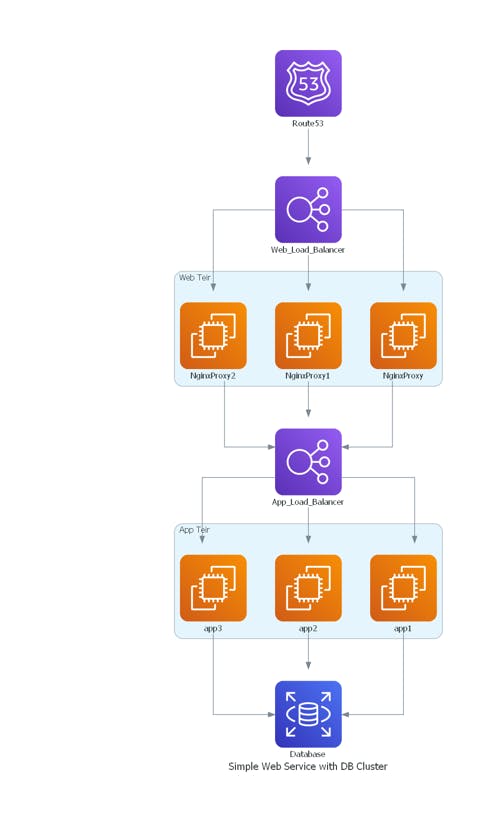


Author - Dheeraj Choudhary
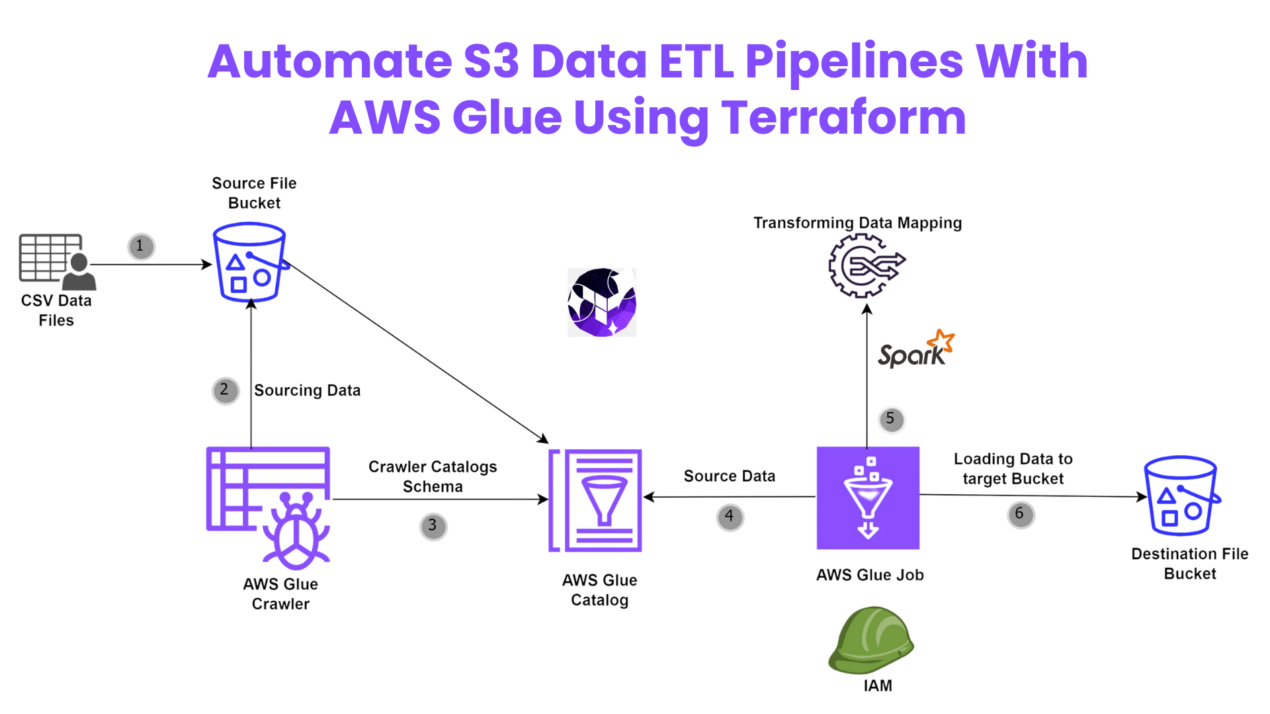
Automate S3 Data ETL Pipelines With AWS Glue Using Terraform
Discover how to automate your S3 data ETL pipelines using AWS Glue and Terraform in this step-by-step tutorial. Learn to efficiently manage and process your data, leveraging the power of AWS Glue for seamless data transformation. Follow along as we demonstrate how to set up Terraform scripts, configure AWS Glue, and automate data workflows.
Automating AWS Infrastructure with Terraform Functions
IntroductionManaging cloud infrastructure can be complex and time-consuming. Terraform, an open-source Infrastructure as Code (IaC) tool, si ...